Interpreting CNN Knowledge via an Explanatory Graph
Quanshi Zhang, Ruiming Cao, Feng Shi, Ying Nian Wu, and Song-Chun Zhu, in AAAI 2018
You can download the paper and code. Please contact Dr. Quanshi Zhang if you have questions.
Abstract
This paper learns a graphical model, namely an explanatory graph, which reveals the knowledge hierarchy hidden inside a pre-trained CNN. Considering that each filter in a conv-layer of a pre-trained CNN usually represents a mixture of object parts, we propose a simple yet efficient method to automatically disentangles different part patterns from each filter, and construct an explanatory graph. In the explanatory graph, each node represents a part pattern, and each edge encodes co-activation relationships and spatial relationships between patterns. More importantly, we learn the explanatory graph for a pre-trained CNN in an unsupervised manner, i.e., without a need of annotating object parts. Experiments show that each graph node consistently represents the same object part through different images. We transfer part patterns in the explanatory graph to the task of part localization, and our method significantly outperforms other approaches.
Introduction
We propose a simple yet effective method to automatically discover object parts from a filter’s feature maps in an unsupervised manner without ground-truth part annotations. We disentangle feature components of object parts from feature representations of each convolutional filter.
This figure shows an explanatory graph.
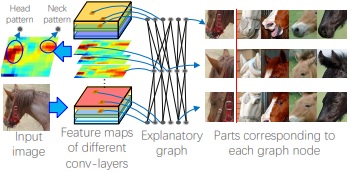 1. The explanatory graph has multiple layers. Each layer corresponds to a conv-layer in the CNN.
2. Each node in the explanatory graph represents a specific part pattern. We disentangle object-part components from features of each filter. Thus, we may learn multiple nodes from a single filter.
3. Each edge in the explanatory graph models the co-activation relationship and the deformable spatial relationship between nodes.
4. A node in a high layer represents a large part, while its connected nodes in the lower layer describe sub-regions of the part.
5. We can consider the explanatory graph as compression of middle-layer features in a CNN. We use thousands of graph nodes to represent information encoded in millions of neural units in middle conv-layers. Given an input image, its feature maps of conv-layers can only trigger a limited number of graph nodes.
Algorithm
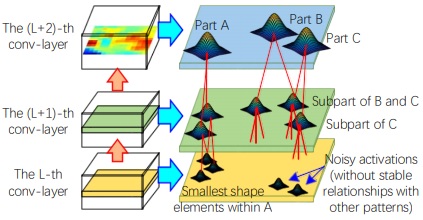
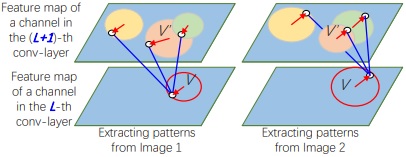
As shown on the left of the above figure, we consider each node as a Gaussian distribution of neural activations in a feature map. The objective of learning is to obtain optimal connections and spatial relationships between nodes. Each node has tens of parent nodes in the upper layer. The core of learning is to mine a number of cliques (right of the above figure), each containing a child node and tens of parent nodes that keep stable spatial relationships through different images. We believe that stable spatial relationships with lots of parent nodes can ensure a clear semantic meaning of the child node.
 We learn the explanatory graph (see the right figure) in a top-down manner. We first learn nodes in the first layer. We then learn nodes in the second layer that keep stable relationships with nodes in the first layer. Based on nodes in the second layer, we learn nodes in the third layer. More specifically, we initialize nodes in the k-th layer by assigning full connections and random spatial relationships. We then gradually revise connections and spatial relationships between nodes via bootstrapping.
Experiments
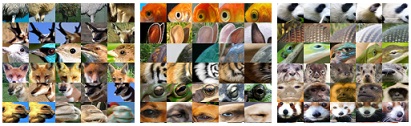
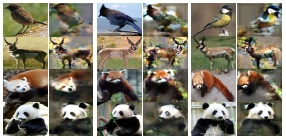
(left) Image patches corresponding to different nodes in the explanatory graph. (right) Image synthesis results based on patterns activated on an image. The explanatory graph only encodes major part patterns hidden in conv-layers, rather than compress a CNN without information loss. Synthesis results demonstrate that the patterns are automatically learned to represent foreground appearance, and ignore background noises and trivial details of objects.
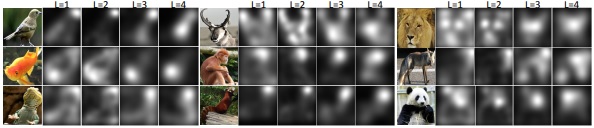
Heat maps of patterns. We use a heat map to visualize the spatial distribution of the top-50% patterns in the L-th layer of the explanatory graph with the highest inference scores.
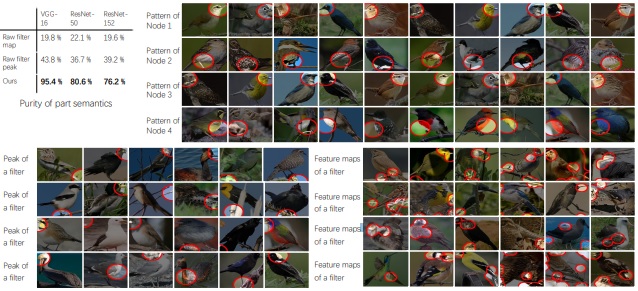
Purity of part semantics. We draw image regions corresponding to each node in an explanatory graph and image regions corresponding to each pattern learned by other methods. We use human users to annotate the semantic purity of each node/pattern. Cyan boxes show inference results that do not describe the common part. Nodes in the explanatory graph exhibit more meaningful semantics than patterns learned by other methods.
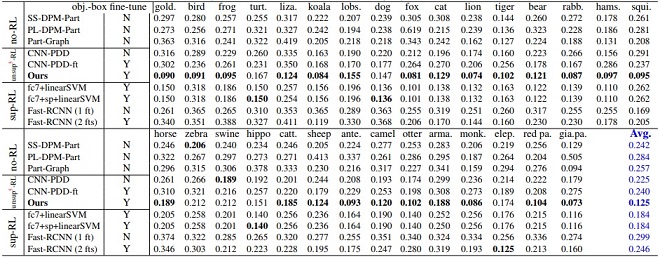
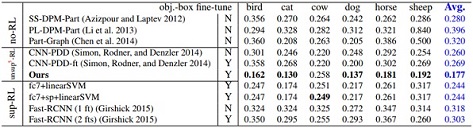
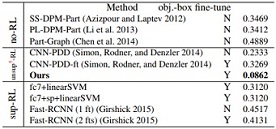
Normalized distance (error) of part localization based on nodes in the explanatory graph. We only use three bounding-box annotations for each part to weakly supervise the learning of localization models. We list results based on the ILSVRC 2013 DET Animal-Part dataset (top), the Pascal-Part dataset (bottom-left), and the CUB200-2011 dataset (bottom-right). The second column indicates whether the baseline used all object-box annotations in the category to fine-tune a CNN.